
Grafana Loki vs. ELK: A Cost and Query Capability Deep Dive
A detailed comparison of Grafana Loki and the ELK Stack for log aggregation, focusing on storage costs, query flexibility, and label cardinality impact.
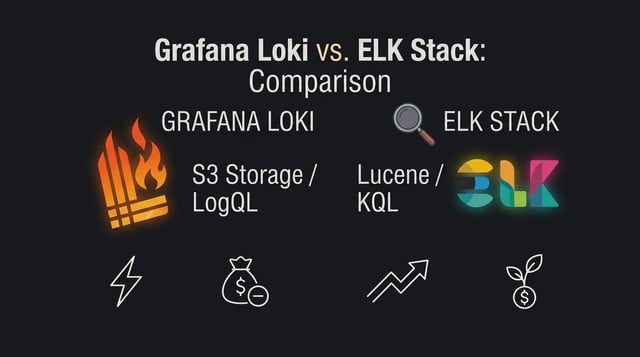
Introduction: Choosing Your Log Aggregation Stack
As DevOps, SRE, and Cloud engineers, we’re constantly evaluating tools that offer the right balance of performance, features, and cost. Log aggregation is a critical component of any observability strategy, providing the raw data needed for debugging, monitoring, and security analysis. Two prominent players in this space are the ELK Stack (Elasticsearch, Logstash, Kibana) and Grafana Loki. While both effectively aggregate logs, their underlying architectures lead to significant differences in cost-effectiveness and query capabilities.
This article dives into a practical comparison, focusing on the core architectural distinctions that drive these trade-offs. I’ll explore when Loki offers a meaningfully cheaper solution than ELK, what query capabilities you might sacrifice, and critically, how label cardinality choices directly impact Loki’s cost and performance profile.
Architectural Foundations: Indexing Strategies
The fundamental difference between Loki and ELK lies in their approach to indexing. This single distinction dictates most of their respective strengths and weaknesses.
ELK: Full-Text Indexing for Deep Search
The ELK Stack, at its core, uses Elasticsearch, a powerful search engine built on Apache Lucene. Elasticsearch indexes the entire content of every log line, creating an inverted index. This full-text indexing allows for incredibly flexible and powerful search capabilities. You can search for any string, pattern, or field within your logs, often in near real-time, without needing to pre-define what you’re looking for. This makes ELK exceptionally strong for ad-hoc investigations, security forensics, and business analytics where the exact search criteria might not be known beforehand.
The trade-off for this power is storage cost. Indexing every word and token in every log line significantly increases the data footprint. Based on my experience and industry benchmarks, raw log data can expand to 5x-15x its original size when fully indexed in Elasticsearch, depending on the data’s structure and indexing configurations.
Grafana Loki: Labels for Efficiency
Grafana Loki takes a “logs are just logs” approach. Instead of indexing the full log content, Loki indexes only a small set of metadata called “labels” for each log stream. The actual log content is compressed and stored directly, typically in object storage like AWS S3 or Google Cloud Storage.
This label-only indexing is Loki’s secret sauce for cost efficiency. Since only metadata is indexed, the storage overhead is drastically reduced. Log files, once compressed, typically become approximately 1x-3x their raw size, a significant reduction compared to ELK. This efficiency is particularly beneficial in cloud-native and Kubernetes environments, where log volumes can be immense.
Storage Cost Comparison: When Loki Wins
Let’s put some concrete numbers to the storage cost. Consider a scenario where you’re ingesting 1TB of raw log data per month:
- ELK Stack (Elasticsearch): With a 5x-15x expansion factor, 1TB of raw logs could require 5TB to 15TB of storage in Elasticsearch. If you’re running self-hosted Elasticsearch clusters, this translates directly to higher disk costs (e.g., EBS volumes in AWS, persistent disks in GCP) and potentially more powerful instances to handle the I/O. For managed services, this directly impacts your per-GB ingestion and storage costs.
- Example Estimate: If managed Elasticsearch costs $0.10/GB/month for hot storage, 5TB would cost $500/month just for storage, not including compute for indexing and querying.
- Grafana Loki: With a 1x-3x expansion factor, 1TB of raw logs would require 1TB to 3TB of storage. Since Loki typically stores log content in cheaper object storage, the cost savings are substantial.
- Example Estimate: Storing 3TB in AWS S3 Standard costs approximately $0.023/GB, totaling around $69/month for storage. Even with some additional costs for the index and query nodes, this is significantly less than ELK.
When is Loki meaningfully cheaper? Loki is almost always meaningfully cheaper for storage when dealing with high volumes of logs, especially if you can effectively leverage object storage. The cost difference becomes starker as your log volume scales. If your primary goal is cost-effective log retention and you know what you’re looking for (i.e., you can define relevant labels), Loki is a strong contender.
Query Capabilities: Flexibility vs. Efficiency
The indexing strategy also defines the query experience.
ELK’s Query Powerhouse
ELK’s full-text indexing shines when you need to perform broad, exploratory searches. Using Kibana Query Language (KQL) or Lucene query syntax, you can:
- Search for any keyword across all log fields.
- Combine complex boolean logic (AND, OR, NOT).
- Perform aggregations, generate dashboards, and build sophisticated analytics.
- Conduct security forensics, identifying anomalous patterns or specific strings that might not have been anticipated.
For example, if you suddenly need to find all instances of a specific error message OutOfMemoryError that occurred within a particular microservice payment-gateway and had a response time greater than 500ms, ELK can execute this query efficiently across its inverted index.
Loki’s Targeted Efficiency with LogQL
Loki’s query language, LogQL, is designed for efficiency based on its label-first architecture. A LogQL query always starts by selecting log streams based on their labels, similar to how Prometheus selects metrics.
logql {job=“api-server”, env=“production”} |= “error”
This query first filters for log streams where job is api-server and env is production, then it applies a regex filter (|= "error") on the content of those specific log streams.
What query capabilities do you give up?
- Broad Full-Text Search: While LogQL supports regex filtering on log content, it’s not as efficient as Elasticsearch for broad, unstructured full-text searches across all logs. If you don’t know the labels of the logs you’re looking for, Loki has to scan more data, which can be slower and more resource-intensive.
- Complex Aggregations: Loki is primarily designed for log querying and basic aggregations (e.g., counting log lines, calculating rates). It doesn’t offer the rich, analytical aggregation capabilities of Elasticsearch, which can perform complex statistical analysis, machine learning, and more. For advanced analytics, you might export Loki data to a dedicated analytics platform.
- Ad-Hoc Exploratory Search: If your primary use case involves frequently searching for arbitrary strings or patterns within a vast sea of logs without predefined labels, ELK will generally provide a faster and more fluid exploratory experience.
When does that matter? It matters if your operational workflow frequently involves “needle in a haystack” searches without prior knowledge of log sources or structures. For security teams conducting deep forensic analysis, or business intelligence teams needing to extract complex insights from log data, ELK’s capabilities are often superior.
However, for typical SRE and DevOps use cases—debugging specific services, checking application health, or correlating logs with metrics—Loki’s label-based approach is often perfectly adequate and significantly more cost-effective.
The Critical Role of Label Cardinality in Loki
A key aspect of optimizing Loki’s cost and performance is understanding and managing label cardinality.
What is Label Cardinality? In Loki, a “stream” is defined by a unique set of label key-value pairs. High label cardinality occurs when you have too many unique combinations of label values. For example, if you add a label like request_id or timestamp to every log line, you would create a new stream for almost every single log line, leading to extremely high cardinality.
How does high label cardinality change the cost profile?
- Increased Index Size: Loki’s index stores label combinations. More unique streams mean a larger index, which consumes more memory on the ingesters and query path, leading to higher compute costs.
- Degraded Query Performance: When a query targets high-cardinality labels, Loki has to scan through many more index entries to find the relevant streams. This increases query latency and resource consumption.
- Higher Ingestion Costs: While the log content itself is cheap in object storage, the overhead of managing and indexing an excessive number of streams can increase the compute resources required for ingestion.
Best Practices for Loki Labels:
- Low Cardinality: Use labels that describe the source of the logs, not the content. Think
job,app,namespace,cluster,env,instance,host. These labels should have a limited, predictable set of values. - Long-Lived: Labels should typically remain constant for the lifetime of the log source.
- Avoid Dynamic Labels: Do not use labels for values that change frequently or are unique per log line, such as timestamps, request IDs, user IDs, or error messages. These should remain in the log content and be filtered via LogQL’s content matching.
- Keep it Small: Aim for a small set of highly descriptive labels per stream.
I’ve seen environments where misconfigured Loki labels, especially those with high cardinality, led to performance issues and unexpected cost spikes, effectively negating the storage savings. It’s a common pitfall that requires careful planning during implementation.
Self-Hosted vs. Managed Services
Both Loki and ELK offer self-hosted open-source versions and managed cloud services.
- Self-Hosted: Provides maximum control and potentially lower direct software costs, but requires significant operational overhead for deployment, scaling, maintenance, and upgrades. For ELK, this means managing Elasticsearch clusters, Logstash pipelines, and Kibana instances. For Loki, it involves managing ingesters, queriers, distributors, and object storage.
- Managed Cloud Options: Services like Grafana Cloud for Loki or AWS OpenSearch Service (managed Elasticsearch) abstract away much of the operational complexity. However, they come with usage-based costs that can vary significantly based on data volume, retention periods, and specific features enabled. While managed services simplify operations, understanding the underlying cost drivers (like data ingress, storage, and compute for indexing/querying) remains crucial for cost optimization.
Conclusion
The choice between Grafana Loki and the ELK Stack boils down to your specific needs, budget, and operational patterns.
Choose Grafana Loki when:
- Cost-effectiveness for high log volumes is a top priority.
- You can define clear, low-cardinality labels for your log sources.
- Your primary use cases involve targeted searches based on known log sources, correlating logs with metrics, or basic log content filtering.
- You are comfortable with LogQL’s query model.
Choose the ELK Stack when:
- You require powerful, ad-hoc full-text search capabilities across all log content.
- Complex aggregations, advanced analytics, and machine learning on log data are essential.
- Security forensics or deep exploratory data analysis is a frequent requirement.
- You have the budget to support the higher storage and compute demands of full-text indexing.
I’ve found Loki to be an excellent fit for modern cloud-native applications where logs are often structured and emitted from well-defined services. For legacy monolithic applications or scenarios demanding deep data exploration, ELK often remains the stronger choice. Understanding these trade-offs, particularly around storage costs and query flexibility, is key to making an informed decision that aligns with your engineering goals and budget.