
Prometheus + Thanos: Long-Term Metrics in Multi-Cluster EKS
Extend Prometheus's metric retention across multi-cluster Kubernetes environments using Thanos, comparing architectures and cost implications.
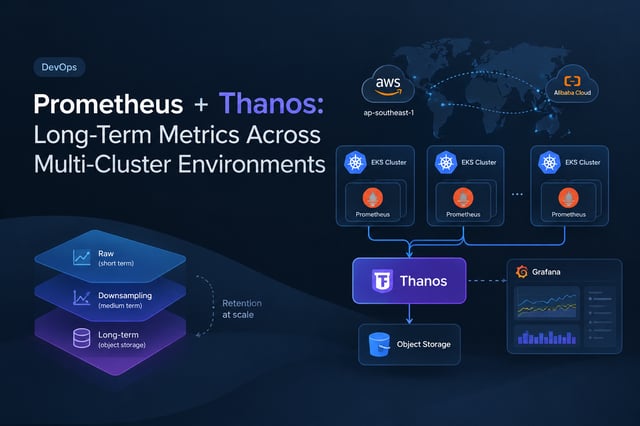
Extending Prometheus for Multi-Cluster, Long-Term Metrics
Prometheus has become the de-facto standard for monitoring in Kubernetes environments. Its robust data model and powerful query language (PromQL) make it invaluable for understanding the health and performance of our systems. However, Prometheus’s architecture, particularly its reliance on local storage, presents challenges for long-term metric retention and multi-cluster aggregation. As SRE and DevOps engineers managing EKS clusters across multi-cloud environments (like AWS ap-southeast-1 and Alibaba Cloud), I frequently encounter these limitations.
This is where Thanos steps in. Thanos is a set of components that turn a Prometheus deployment into a highly available, long-term metrics system with global query views. It addresses Prometheus’s inherent limitations by integrating object storage, enabling cost-effective, virtually limitless retention, and providing a unified query interface across multiple Prometheus instances, regardless of their location.
In this article, I’ll explore how Thanos extends Prometheus, focusing on the architectural choices for integrating Thanos, the economic benefits of leveraging object storage, the mechanics and implications of downsampling, and a realistic look at cost considerations for scalable long-term metrics.
Thanos Architectures: Sidecar vs. Receive
Thanos offers two primary architectures for ingesting data from Prometheus: the Sidecar and the Receive component. Each has its own tradeoffs in terms of deployment complexity, real-time data access, and operational overhead.
Thanos Sidecar Architecture
The Thanos Sidecar is the most common and often simplest way to integrate Thanos with existing Prometheus deployments. It runs alongside each Prometheus instance, typically in the same pod in Kubernetes.
How it works:
- Proxies API calls: The Sidecar exposes Prometheus’s API, allowing Thanos Query components to treat it as a Prometheus instance. This provides real-time access to currently scraped data.
- Uploads blocks to object storage: Periodically, the Sidecar uploads completed Prometheus TSDB blocks (typically 2-hour blocks) to a configured object storage bucket (e.g., AWS S3, Alibaba Cloud OSS). This offloads historical data from Prometheus’s local disk.
Tradeoffs:
- Pros:
- Simplicity: Easy to deploy alongside existing Prometheus instances with minimal configuration changes.
- Real-time query: The Sidecar provides immediate access to data still residing in Prometheus’s local storage.
- Reduced Prometheus disk pressure: Historical data is moved to cheaper object storage, allowing Prometheus to maintain a shorter local retention.
- Cons:
- Tight coupling: The Sidecar’s health is tied to the Prometheus instance. If Prometheus is down, the Sidecar cannot upload new blocks.
- Per-Prometheus deployment: Each Prometheus instance requires its own Sidecar, which can increase resource consumption across many clusters.
- Not ideal for high-cardinality, high-volume ingest: While it works for many cases, very high-throughput Prometheus instances might benefit from a more decoupled ingest path.
Thanos Receive Architecture
The Thanos Receive component offers a more decoupled and scalable ingest path, particularly suited for high-volume or multi-tenant environments where direct Sidecar deployment isn’t feasible or desired.
How it works:
- Remote Write target: Prometheus instances are configured to remote-write their metrics to the Thanos Receive component. This means Prometheus pushes samples directly to Thanos as they are scraped.
- Ingests and stores: The Receive component ingests these samples, replicates them for high availability, and stores them in its local TSDB, eventually uploading completed blocks to object storage.
- Hashing and Sharding: Receive can be sharded by hashing series labels, distributing the ingest load across multiple Receive instances.
Tradeoffs:
- Pros:
- Decoupled ingest: Prometheus instances are no longer directly responsible for block uploads, improving their stability.
- Scalability: Receive can scale horizontally to handle very high ingest rates and can be sharded.
- High availability: Metrics can be replicated across multiple Receive instances, providing redundancy.
- Better for multi-tenant scenarios: Can act as a central ingest point for many Prometheus instances.
- Cons:
- Increased complexity: Requires deploying and managing additional Thanos components (Receive, potentially a hashring setup).
- Resource intensive: Receive instances themselves need local storage and compute resources for ingesting and processing samples.
- No real-time query from Prometheus: Queries for recent data must go through the Receive component or its underlying object storage, potentially introducing slight latency compared to querying Prometheus directly via a Sidecar.
For our EKS environments, I typically lean towards the Sidecar architecture for its operational simplicity when extending existing Prometheus deployments. However, for greenfield projects or very high-scale, centralized ingest, Receive becomes a compelling option.
Object Storage: Changing the Economics of Retention
Prometheus’s local storage is designed for short to medium-term retention, typically a few weeks to a month, due to the cost and operational complexity of managing large, high-performance local disks. While it’s incredibly efficient for recent data, scaling local storage for years of metrics quickly becomes impractical and expensive.
Thanos fundamentally shifts this paradigm by leveraging object storage (like AWS S3 or Alibaba Cloud OSS). Object storage offers:
- Virtually limitless scalability: You can store petabytes of data without provisioning individual disks.
- Significantly lower cost: Object storage is orders of magnitude cheaper per GB than block storage (EBS volumes, local SSDs).
- Durability and availability: Data is typically replicated across multiple availability zones, offering high durability.
- Managed service: Eliminates the operational overhead of managing underlying storage infrastructure.
By offloading historical Prometheus blocks to object storage, we can configure Prometheus instances to retain only a short window of data locally (e.g., 2-7 days). This drastically reduces the resource requirements for each Prometheus instance, allowing them to focus on scraping and processing recent metrics efficiently. All long-term queries are then served by Thanos components reading directly from object storage.
Downsampling: Balancing Accuracy and Cost
Storing raw, high-resolution metrics for years can be prohibitively expensive and often unnecessary for long-term trend analysis. Thanos addresses this with its Compactor component, which performs downsampling.
How Downsampling Works:
The Thanos Compactor continuously scans object storage for raw Prometheus blocks. It then creates lower-resolution “downsampled” blocks by aggregating raw data points. Typically, two downsampling resolutions are generated:
- 5-minute resolution: Raw data points are aggregated into 5-minute intervals.
- 1-hour resolution: Raw data points are further aggregated into 1-hour intervals.
These downsampled blocks are stored alongside the raw blocks in object storage. When a query comes in, the Thanos Query component intelligently selects the highest resolution data available for the requested time range. For example, if you query for the last 24 hours, it might use raw data. If you query for the last year, it will likely use the 1-hour downsampled data.
When Downsampling Hurts Query Accuracy:
Downsampling involves data aggregation (e.g., taking the average, sum, min, max over an interval), which inherently means losing some granularity.
- Loss of detail for spikes: Short, sharp spikes in metrics might be smoothed out or completely missed in downsampled data, especially with 1-hour resolution. This can be problematic for incident forensics where precise timing and magnitude of an anomaly are critical.
- Altered aggregations: Depending on the aggregation method, certain Prometheus functions might yield slightly different results with downsampled data compared to raw data.
- Debugging granular issues: For deep-dive debugging of specific incidents that occurred months ago, the reduced resolution might make it harder to pinpoint root causes.
Best Practices:
I typically configure Thanos to retain raw data for a period that aligns with our common debugging and incident response windows, often 7 to 30 days. Beyond that, the 5-minute and 1-hour downsampled data is usually sufficient for trend analysis, capacity planning, and long-term reporting. This approach balances cost efficiency with the need for detailed historical context.
A Realistic Cost Comparison for Long-Term Metrics at Scale
Let’s consider an illustrative cost comparison for storing long-term metrics, contrasting Prometheus’s local storage approach with Thanos leveraging object storage across our multi-cloud EKS environments.
Assumptions (Illustrative Estimates):
- Data Ingest: 100,000 active series, with an average of 10 bytes per sample, scraped every 15 seconds. This translates to roughly 2 TB of raw data per month.
- Retention: 1 year of data.
- Prometheus Local Storage: AWS EBS gp3 volumes.
- Thanos Object Storage: AWS S3 Standard (ap-southeast-1) and Alibaba Cloud OSS Standard.
- Thanos Components: EKS cluster compute (e.g., m5.large instances for Query, Store Gateway, Compactor).
Scenario 1: Prometheus with Local Storage (Impractical for 1 year)
To store 24 TB of raw data for a year on local Prometheus instances across multiple clusters would be extremely challenging.
- Storage Cost: 24 TB of EBS gp3 storage at, say, $0.08/GB/month (illustrative) would be $1,920/month per Prometheus instance. If you have 5 clusters, that’s $9,600/month just for storage.
- Operational Overhead: Managing 24TB of EBS volumes per Prometheus instance, ensuring performance, backups, and scaling, is a significant operational burden. Querying across these disparate Prometheus instances would also require manual federation.
- Resource Contention: Large local storage can lead to I/O contention with Prometheus’s scraping and querying, impacting performance.
This scenario quickly becomes cost-prohibitive and operationally unsustainable for long-term, multi-cluster retention.
Scenario 2: Prometheus + Thanos with Object Storage
This is the recommended approach. Each Prometheus instance retains, for example, 7 days of local data, with all historical data offloaded to object storage.
1. Prometheus Local Storage Cost:
- 7 days of raw data: (2 TB/month / 30 days) * 7 days = ~0.47 TB per Prometheus instance.
- For 5 Prometheus instances, total local storage: 0.47 TB * 5 = ~2.35 TB.
- EBS gp3 cost: 2.35 TB * $0.08/GB/month = ~$188/month (illustrative).
2. Thanos Object Storage Cost (1 year retention):
- Raw data (first 30 days, before downsampling kicks in): 2 TB.
- Downsampled data (11 months): The data reduction from downsampling is significant. Let’s assume a 5x reduction for 5-min and 10x for 1-hour resolution on average, leading to an effective storage of ~0.5 TB/month for downsampled data.
- Total object storage for 1 year: 2 TB (raw) + (0.5 TB * 11 months) = ~7.5 TB.
- AWS S3 Standard (ap-southeast-1) cost: 7.5 TB * $0.023/GB/month (illustrative) = ~$172.5/month.
- Alibaba Cloud OSS (example region) cost would be comparable, assuming similar pricing tiers.
- API Requests: Thanos components (Sidecar, Store Gateway, Compactor, Query) make API requests to object storage. For 7.5 TB of data, with typical query patterns, this might add an additional $50-$100/month (illustrative) depending on read/write patterns and data retrieval tiers.
- Network Transfer: In a multi-cloud setup, if Thanos Query components in one cloud query data stored in another, inter-cloud data transfer costs can arise. E.g., querying Alibaba Cloud OSS from AWS EKS. This needs careful planning to minimize, perhaps by deploying Query components in both clouds and using a global DNS for routing. Let’s estimate an additional $50-$200/month (illustrative) for initial multi-cloud transfer, depending on query volume.
3. Thanos Compute Cost (EKS):
- Sidecars: Running alongside Prometheus, they consume minimal CPU/memory.
- Store Gateway: Typically requires moderate CPU/memory and some temporary disk for caching.
- Compactor: The most resource-intensive, requiring significant CPU and memory for block processing, especially when creating downsampled blocks. Often runs on a cron schedule or with autoscaling.
- Query: Moderate CPU/memory, scales with query load.
For a moderate-scale setup across 5 EKS clusters, I might allocate:
- Store Gateway: 2 instances, e.g., m5.large (~$0.096/hour) * 2 * 730 hours = ~$140/month.
- Compactor: 1 instance, e.g., m5.xlarge (~$0.192/hour) * 730 hours = ~$140/month (can be burstable).
- Query: 2 instances, e.g., m5.large (~$0.096/hour) * 2 * 730 hours = ~$140/month.
- Total Compute (Illustrative): ~$420/month.
Total Estimated Cost (Thanos + Object Storage):
- Prometheus Local Storage: ~$188/month
- Thanos Object Storage (data + requests): ~$222 - $272/month
- Thanos Compute: ~$420/month
- Multi-cloud Network Transfer: ~$50 - $200/month
Overall Estimate: ~$880 - $1080/month (illustrative)
This is a significant reduction compared to the local storage approach, and it provides a robust, scalable, and globally queryable metrics system. The key takeaway is that object storage fundamentally changes the cost curve, making long-term retention economically viable.
Operational Considerations and Resource Requirements
Deploying and managing Thanos components in EKS clusters requires careful consideration:
- Helm Charts: Using community Helm charts (e.g., from Prometheus Community) simplifies deployment and management of Thanos components.
- Resource Allocation: Correctly sizing CPU and memory for Thanos components (especially Compactor and Query) is crucial. Monitor their resource utilization and scale accordingly.
- Object Storage Permissions: Ensure Thanos components have appropriate IAM roles or service accounts with permissions to read/write to the designated S3/OSS buckets.
- Networking: Proper network configuration is vital, especially in multi-cluster or multi-cloud setups. Ensure Thanos Query can reach all Store Gateways and that Sidecars can reach object storage endpoints.
- High Availability: Deploy multiple instances of Thanos Query and Store Gateway for redundancy. The Compactor is generally a single instance or can be run as a Kubernetes Job.
- Monitoring Thanos: Just like Prometheus, Thanos components themselves need to be monitored. Prometheus can scrape Thanos metrics to ensure its health and performance.
By carefully planning the architecture, understanding the tradeoffs, and leveraging the cost efficiencies of object storage, Thanos provides a powerful solution for extending Prometheus into a truly scalable, long-term, multi-cluster metrics platform.